The Gap Between What AI Can Do and What It Is Doing — and What It Means for South Carolina Workers
South Carolina's largest occupational group — 283,500 administrative and office workers — sits squarely in the path of AI's next wave of displacement. A March 2026 Anthropic report shows exactly why, and the picture is more urgent than most people realize.
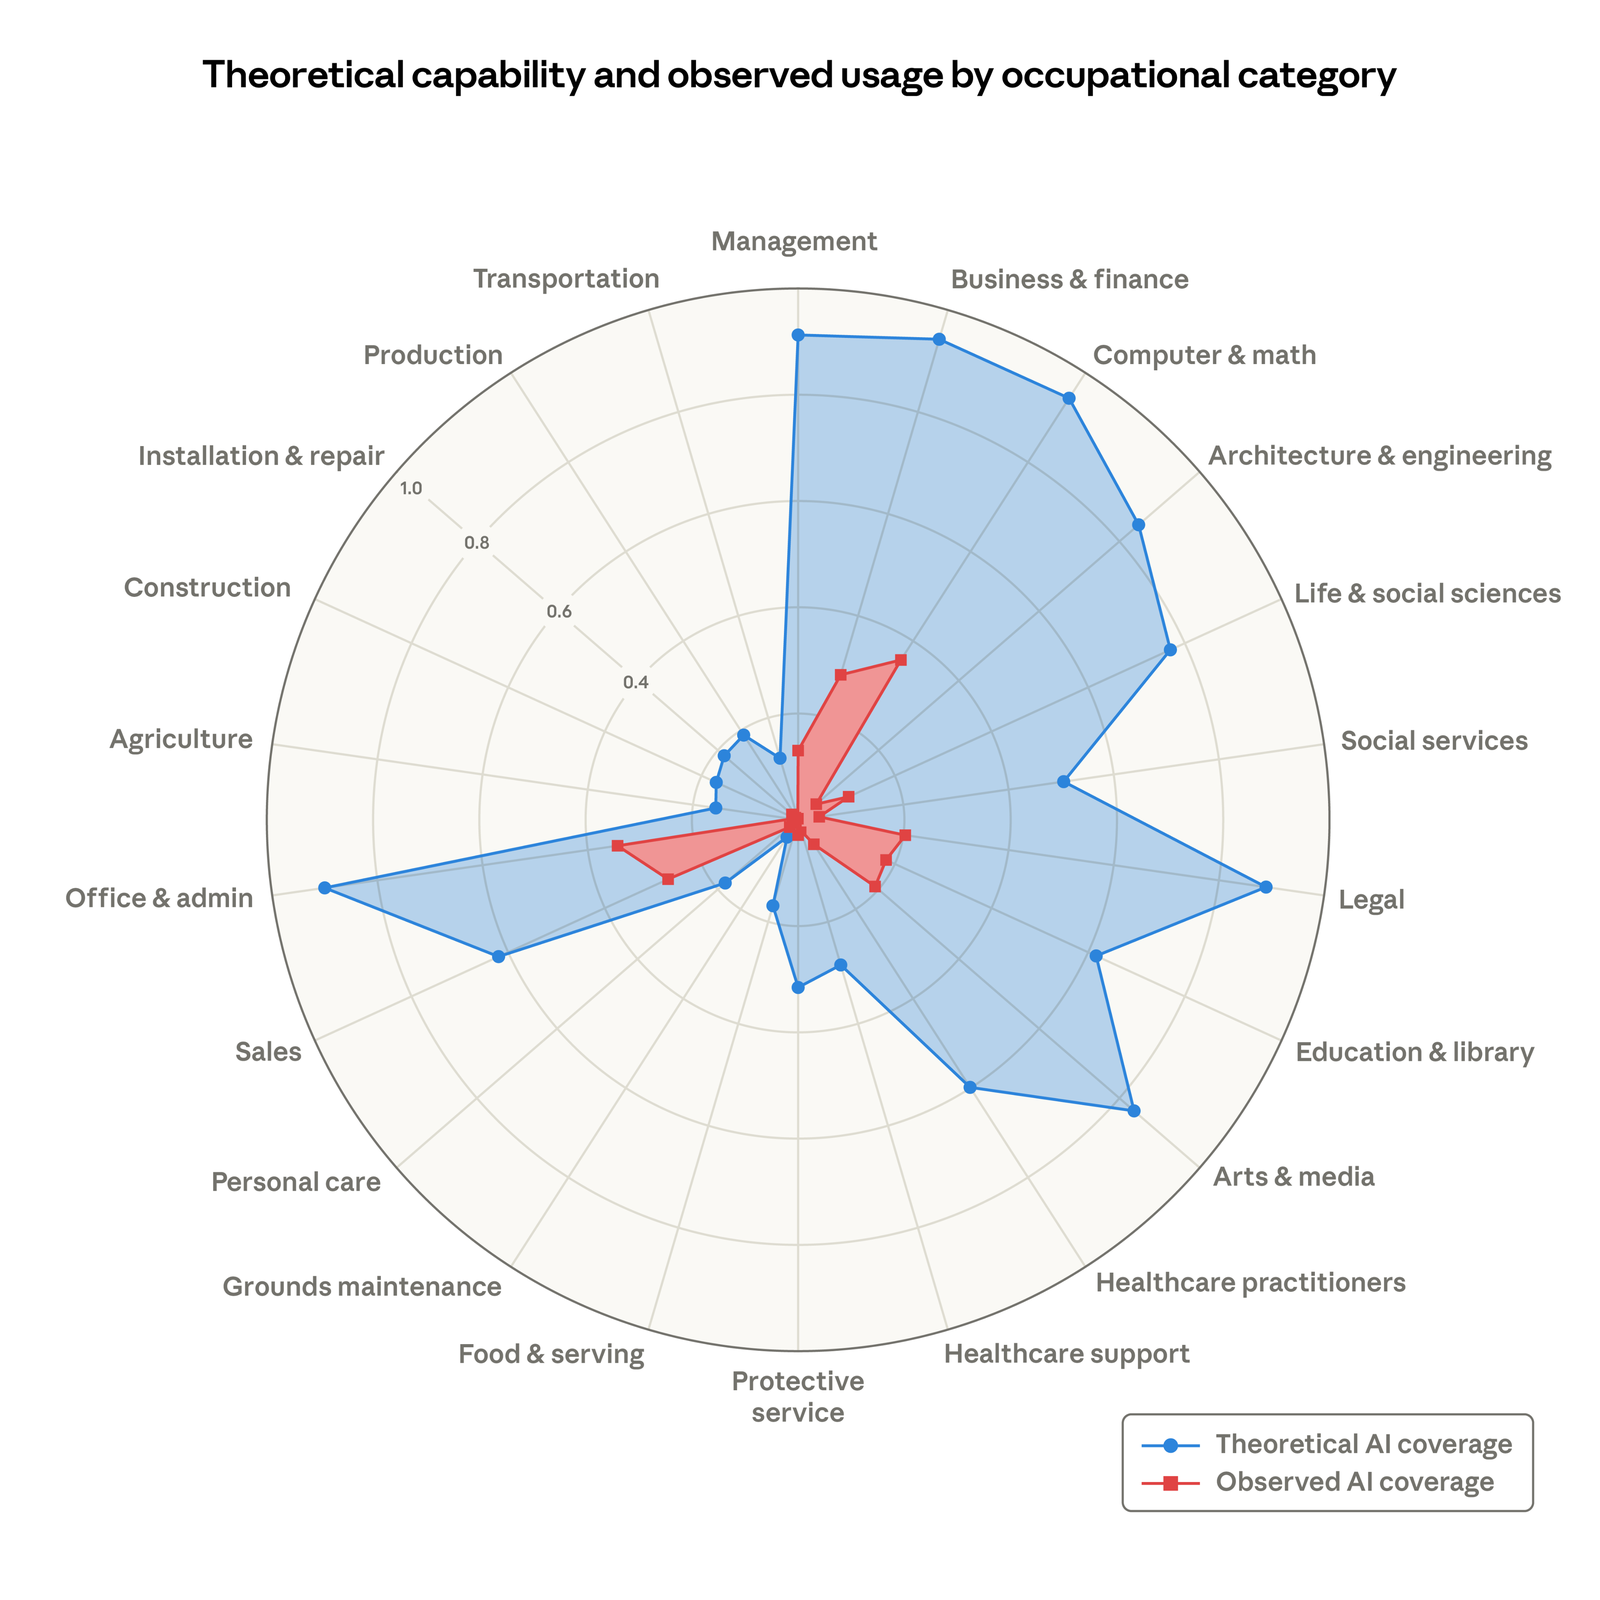
That chart went viral when Anthropic published it last month — and for good reason. The blue shape is everything AI could theoretically handle right now across the economy. The red shape is what AI is actually doing in professional settings. Two things stand out immediately: the ceiling is much higher than most people assume, and the floor is rising fast.
Which jobs are most exposed right now
The report measures observed exposure — not theoretical potential, but what AI is actually being used for in work settings today, with fully automated use weighted more heavily than assistive use. The top occupations are striking precisely because they're not the jobs most people associate with automation risk:
These are not low-wage workers. The most exposed group skews female, older, more educated, and better-paid than average — workers with graduate degrees are nearly four times as prevalent in the most exposed category as in the least. The manufacturing floor worker, the plumber, the cook currently face near-zero AI exposure. The administrative assistant, the customer service rep, the financial analyst — these are where risk is concentrating now.
What South Carolina's workforce looks like through this lens
A tale of two labor markets
South Carolina's labor market maps onto the Anthropic chart in a specific and revealing way. The state's largest occupational group — Office and Administrative Support — sits squarely in the second-most exposed category nationally, with 34% observed AI coverage and 90% theoretical capability. These are the workers most visibly in the deployment gap's path as the red area expands toward the blue.
At the same time, South Carolina's outsized manufacturing base — anchored by BMW, Boeing, Volvo, and hundreds of suppliers — currently sits at the outer edge of the chart, in the lowest-exposure zone. Those physical-presence jobs are largely protected from AI's current reach. But the administrative, logistics coordination, and quality management roles embedded in those same facilities are not.
The two-track exposure problem
South Carolina has an unusual exposure profile because its economy runs on two very different tracks:
White-collar & administrative SC
- Office & admin support (283,500)
- Customer service roles
- Insurance claims processing
- Medical billing & coding
- Financial & accounting roles
- Government administrative roles
- Marketing & sales support
Physical-presence SC
- Manufacturing production (263,800)
- Construction trades
- Healthcare direct care
- Food service & hospitality
- Agricultural workers
- Transportation & logistics drivers
- Maintenance & repair
This split matters for policy. South Carolina's workforce development programs, technical colleges, and workforce boards have historically focused on the state's manufacturing base — for good reason, given its size and economic weight. But the more acute near-term exposure risk is concentrated in the administrative and service occupations that surround and support that manufacturing base, not on the production floor itself.
Notably, Columbia's concentration of office and administrative support workers — at 13.7% of the metro area's employment versus 11.8% nationally — puts the capital region at higher-than-average exposure. The report found Columbia-area workers in insurance claims processing and collections roles employed at twice the national rate.
The good news — and the important caveat
The report is careful to note what the data does and does not show. As of early 2026, there is no systematic increase in unemployment among highly exposed workers. The disruption that the chart implies is coming has not yet arrived in the unemployment statistics in a measurable way.
"We find no systematic increase in unemployment for highly exposed workers since late 2022, though we find suggestive evidence that hiring of younger workers has slowed in exposed occupations."
— Anthropic, Labor Market Impacts of AI, March 5, 2026The caveat is in that second clause. While unemployment has not risen, hiring of young workers in exposed occupations has slowed — with one study finding a 14% drop in the job-finding rate in exposed occupations post-ChatGPT. For South Carolina's college graduates entering the workforce, this is not abstract. The entry-level administrative, customer service, and clerical roles that have historically served as a first rung on the career ladder are precisely the ones with the highest AI exposure.
This is the scenario that warrants the most attention from South Carolina policymakers: not mass layoffs of existing workers, but a slow contraction in hiring for the entry-level positions where young workers build their early careers. Workers who are not hired may not appear in unemployment statistics — they may simply return to school, extend their time in lower-wage service jobs, or exit the formal labor force entirely.
What this means for South Carolina
The Anthropic chart should not be read as a prediction of catastrophe. The enormous gap between the blue and red shapes is, in one sense, reassuring — AI is far from replacing the majority of professional work even in the most exposed occupations. The theoretical ceiling is high, but the deployment gap is real and meaningful.
But that gap is narrowing. The red area will grow toward the blue. The question for South Carolina is not whether this happens, but how the state positions its workforce, its education and training systems, and its policy frameworks before the growth arrives rather than after.
Several things follow from this analysis:
SC's workforce development investment is pointed at the wrong risk. The manufacturing sector — which receives the lion's share of workforce program attention — currently faces minimal direct AI exposure. The administrative and service sector, which faces the most immediate risk, receives comparatively little structured AI readiness programming.
The education-to-work pipeline needs attention now. Young workers entering exposed occupations are already seeing slowed hiring. South Carolina's technical colleges and universities should be examining whether they are preparing graduates for roles that are currently contracting, and whether career pathways are being built toward roles that are expanding.
Physical-presence protection is temporary. Manufacturing's current low exposure does not mean it is permanently protected. As AI capabilities extend into robotics, quality control, and supply chain optimization, the production floor will become more exposed over time. South Carolina's manufacturing base should be preparing for a second wave of AI impact even as it navigates the first.
SCAIO will continue tracking this data as it develops. The Anthropic research team plans to revisit these analyses periodically as both AI capabilities and adoption patterns evolve. We will update our analysis accordingly and report on how South Carolina's specific occupational mix is tracking against national exposure trends.
The radar chart above is SCAIO's adaptation for legibility; the original appears in Figure 2 of the Anthropic report. Occupational exposure values are drawn directly from Anthropic's reported data. South Carolina employment figures are from the SC Department of Employment and Workforce via BLS, 2024.